Visual Computing made easy
Computer Vision. Image Processing. Data Visualization.
All drag-and-drop in the browser.
Computer Vision. Image Processing. Data Visualization.
All drag-and-drop in the browser.
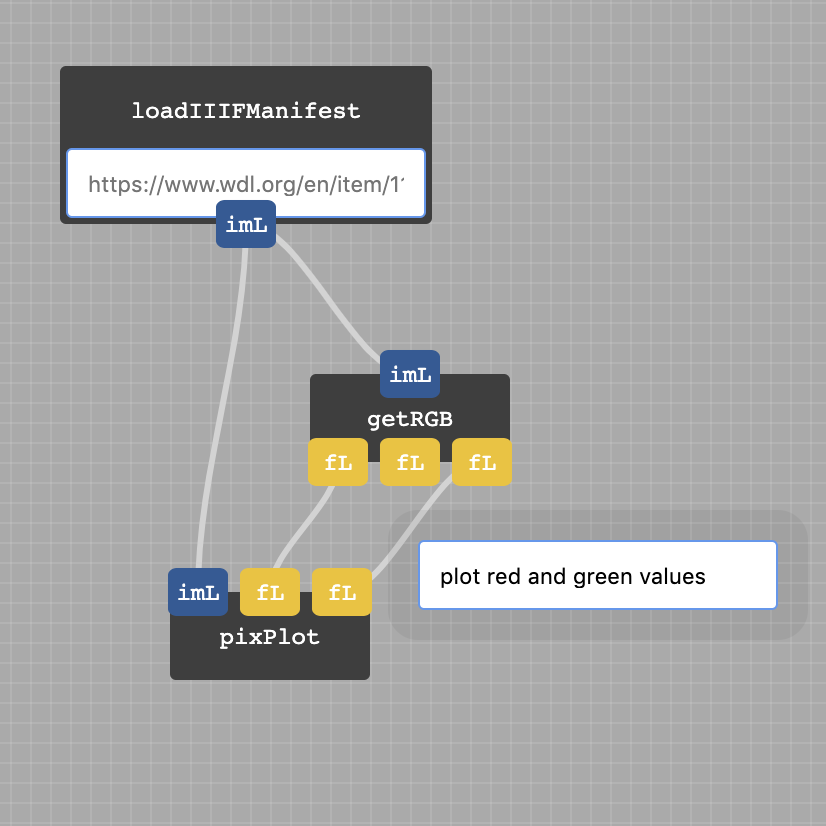
Drag and drop functions for input, analysis, and visualization; then link them together.
ImageGraph turns your flowchart into ready-to-go Python, in the browser.
Paste your code into a local Python instance, or onto Google Colab.
The ImageGraph library can be installed anywhere with pip and an internet connection.
No coding experience required